~ 2 min read
How to Calculate a Correlation Matrix in Excel

How to Calculate a Correlation Matrix in Excel
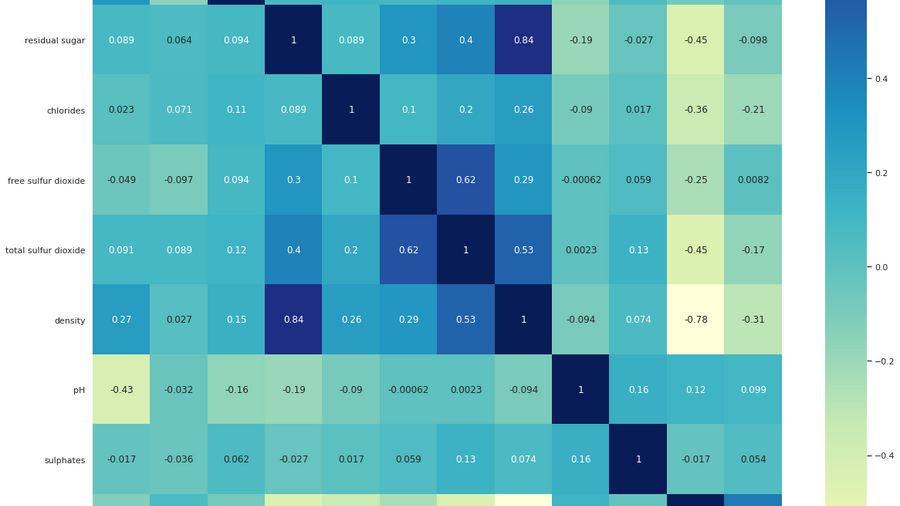
A correlation matrix is a table that shows the correlation coefficients between a set of variables. These coefficients are used to measure the linear relationship between the variables, and can range from -1 (perfect negative correlation) to 1 (perfect positive correlation). Calculating a correlation matrix in Excel can be a useful tool for understanding the relationships between different variables in a dataset.
How to Calculate a Correlation Matrix in Excel
- Have your data in an Excel spreadsheet, including the different variables that you want to analyze, as well as their corresponding values.
- Use Excel's built-in CORREL function to calculate the correlation coefficients between each pair of variables. The syntax for this function is:
=CORREL(variable1, variable2). - Use the CORREL function to calculate the coefficients for all possible pairs of variables. Arrange the coefficients in a table, with the variables on the rows and columns, and the corresponding coefficients in the cells.
- Interpret the resulting correlation matrix to understand the relationships between the variables in your dataset. A coefficient close to 1 indicates a strong positive relationship, while a coefficient close to -1 indicates a strong negative relationship. A coefficient close to 0 indicates a weak or no relationship.
By following these steps, you can easily calculate a correlation matrix in Excel and use this information to understand the relationships between different variables in your dataset.
By following these steps, you can easily calculate Correlation Matrix in Excel and use this information to make informed decisions about your investment portfolio. Additionally, you can use a tool like Gorilla Terminal to easily manage your portfolio and calculate Correlation Matrix with just a few clicks, without the need for complex Excel formulas.